Service Application: MONITORING _

_ Monitoring of operating parameters and equipment status in real time
Application designed for real-time visualization and monitoring of operating parameters and the status of industrial equipment.
Machine data is presented through specific visualizations that facilitate interpretation, enabling precise monitoring of production processes and asset status.
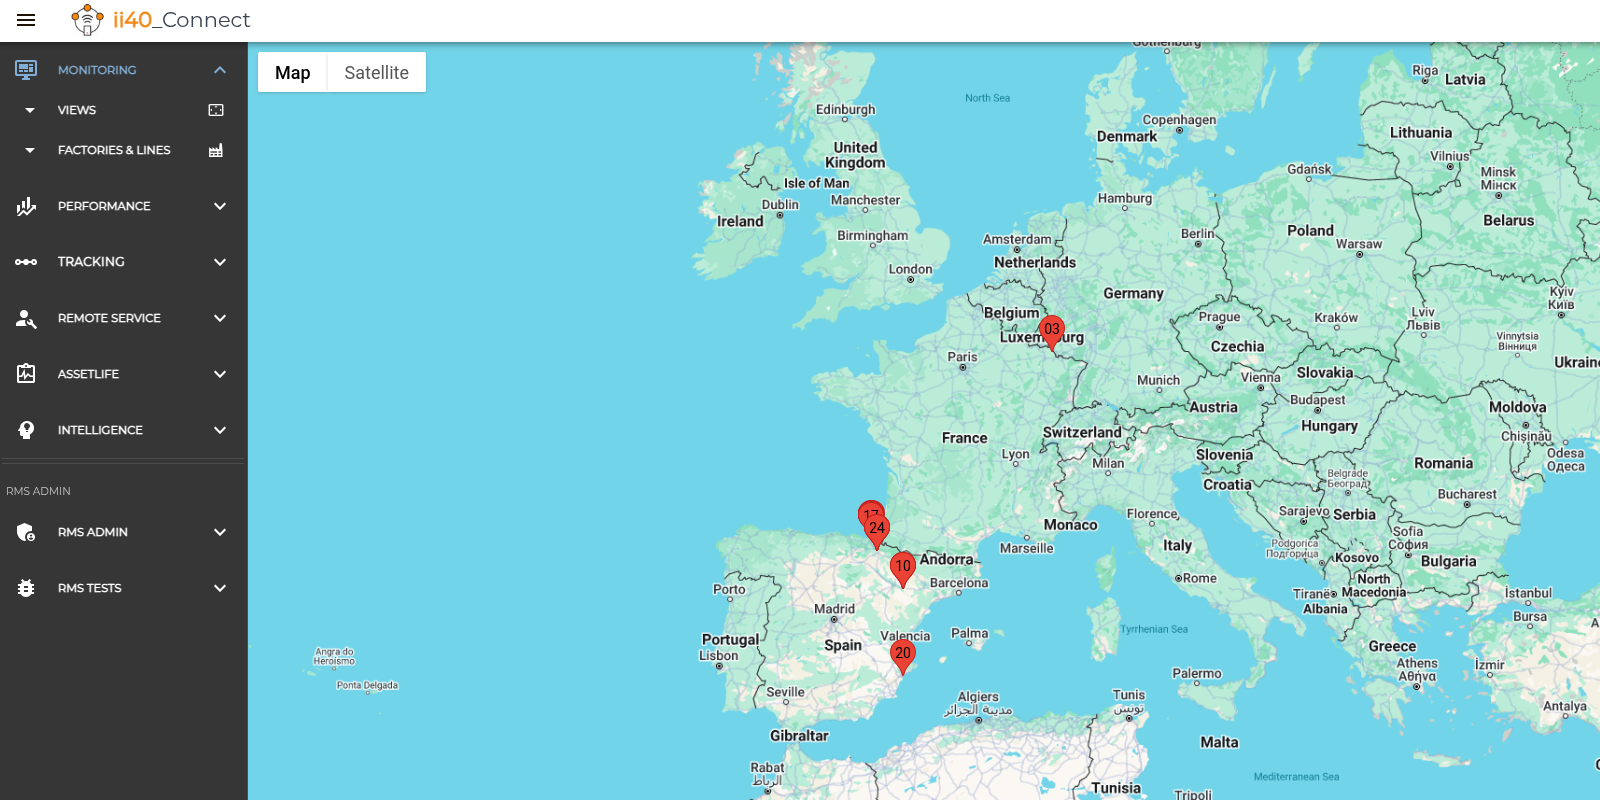
It includes features that allow you to view additional details, access historical data, and analyze them in an advanced manner. It is also the Dashboard for the ii40_Connect ecosystem, incorporating information from key areas such as performance, traceability, maintenance, and equipment lifecycle.
With this solution, you will have all the information you need to thoroughly understand the operation of your equipment and make decisions based on real data.
24/7 monitoring of operational parameters and equipment status
Visualizations adaptable to process, equipment
Alarms and Notifications, with complete history
Historical analysis with time series graphs.
Visualizing KPIs and insights
MONITORING Features _
_ to achieve real-time tracking
COCKPIT
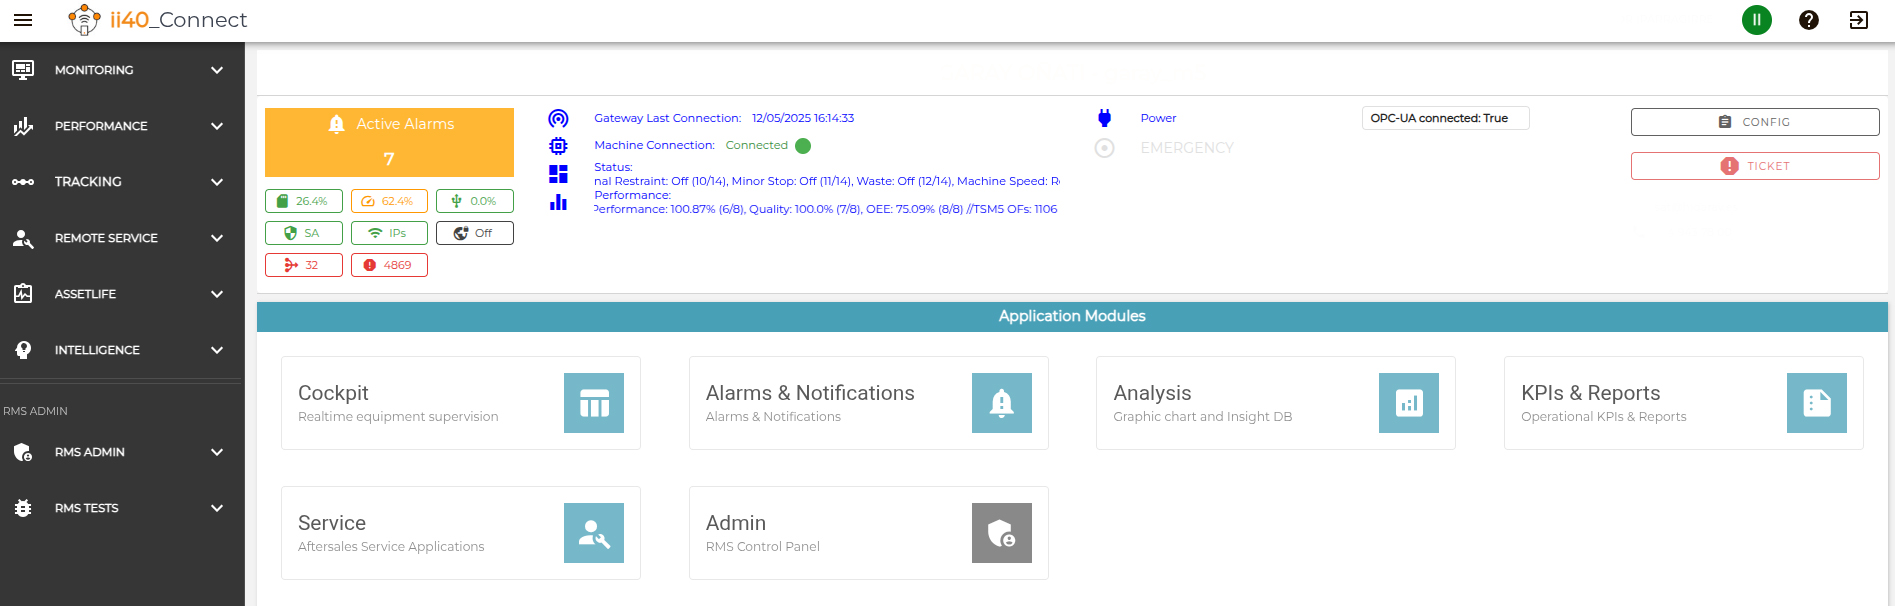
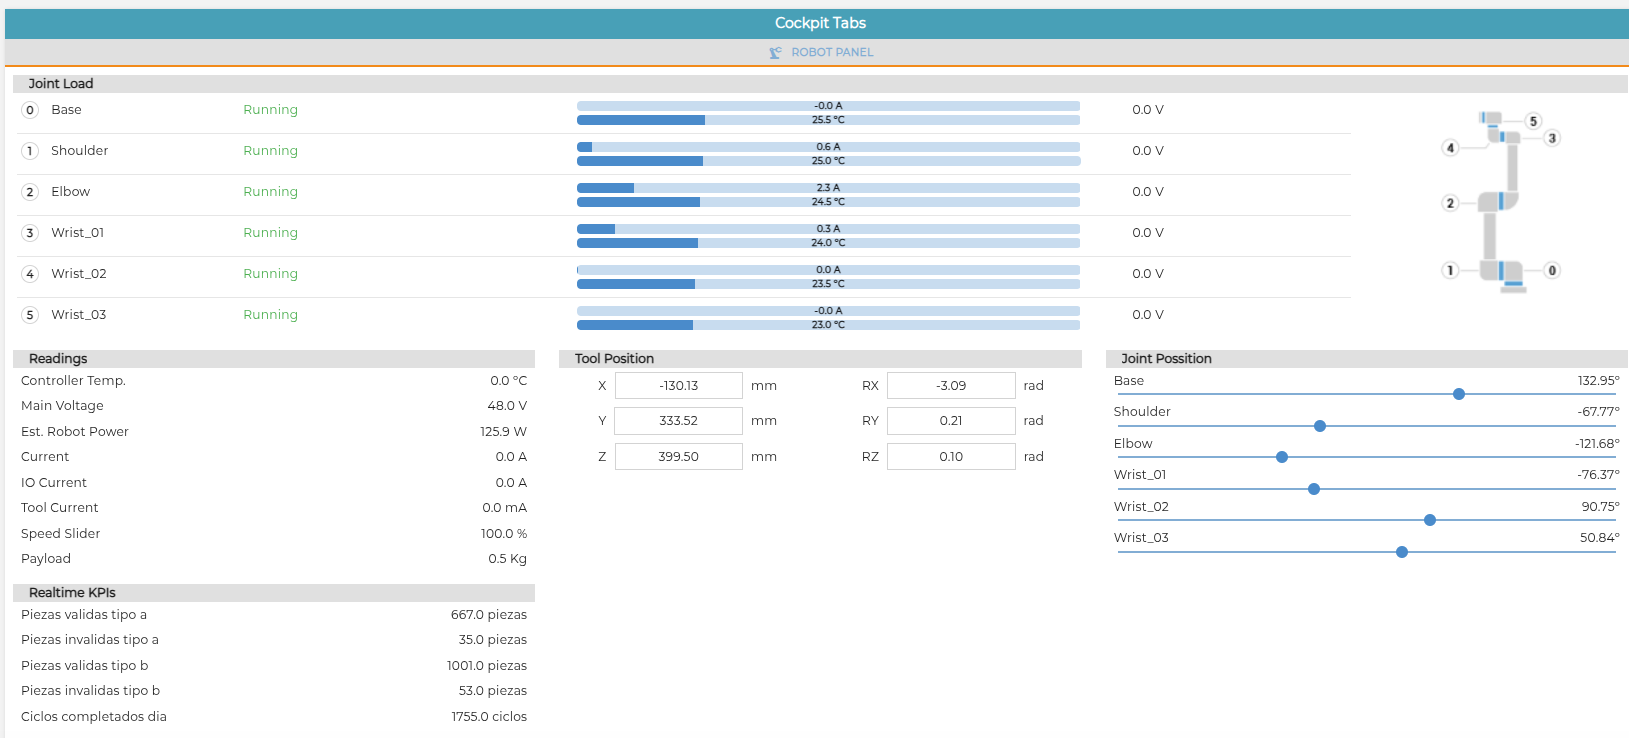
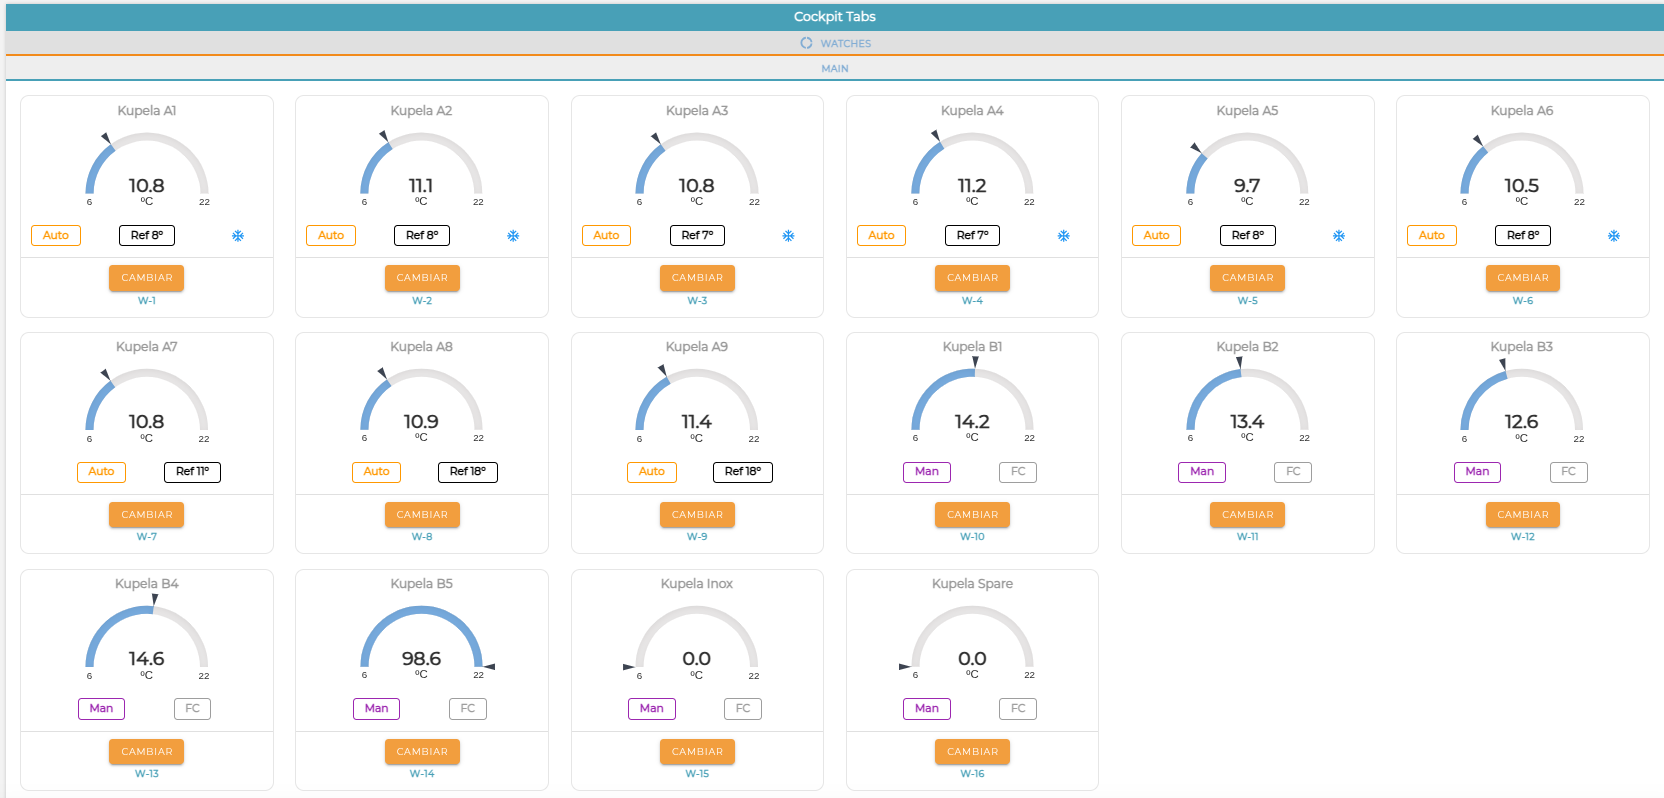
It acts as a central console for real-time visualization of each machine’s operation and status, enabling both individual and fleet-wide monitoring.
It integrates all relevant information into a single environment, including machine data, plant auxiliary systems, ERPs, and other data sources. It also incorporates the results of advanced analytics and predictive models generated by the ii40_Cloud digital twin.
The adaptive visualization allows accurate representation of the specific parameters of each machine and process, providing a clear and actionable understanding of the data.


ALARMS AND NOTIFICATIONS
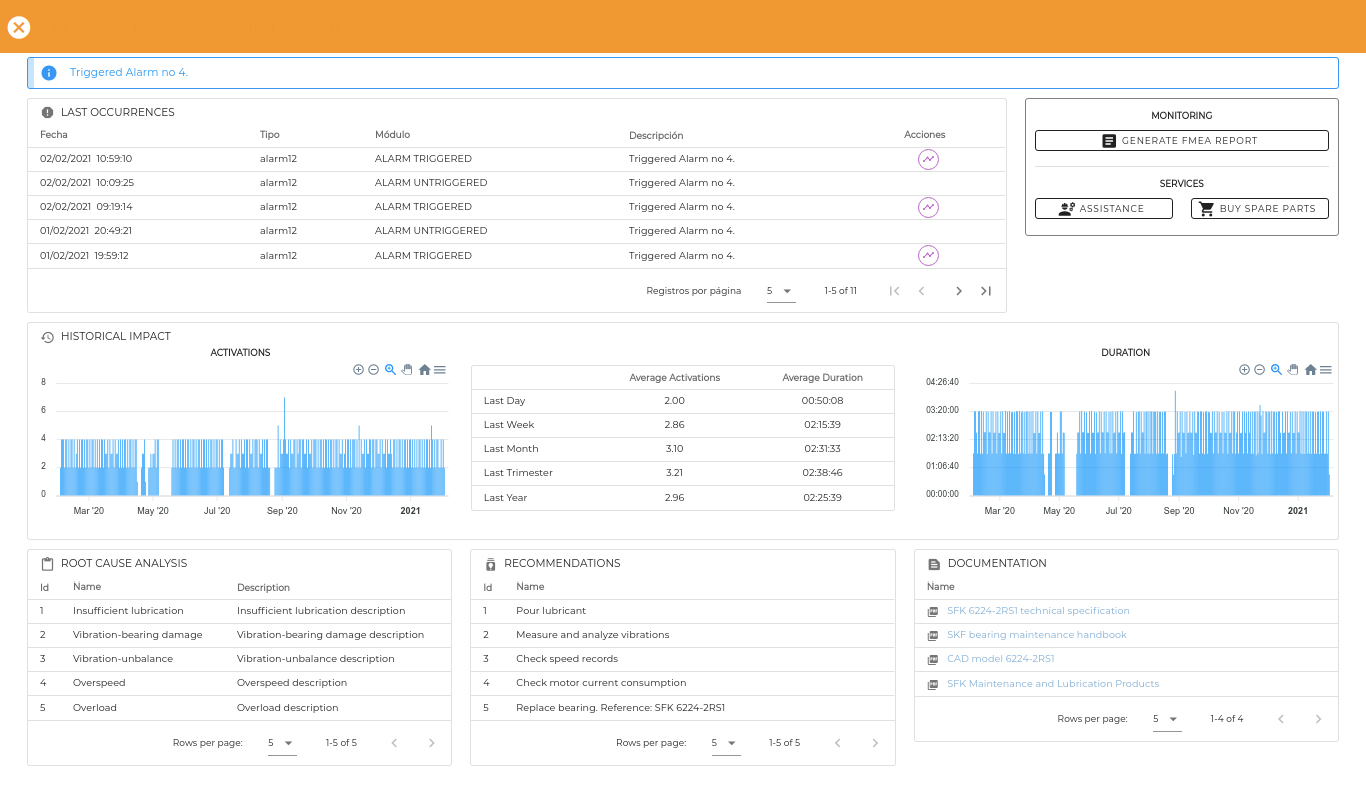
It records and displays equipment alarms and incidents in real time, as well as relevant events defined for each machine.
Additionally, it sends automatic notifications to enable immediate action and minimize response times.
To support diagnostics, troubleshooting, and continuous improvement, the module includes FMEA (Failure Modes and Effects Analysis), assessing the impact of each alarm, identifying potential root causes, and providing practical recommendations for resolution.
HISTORICAL ANALYSIS
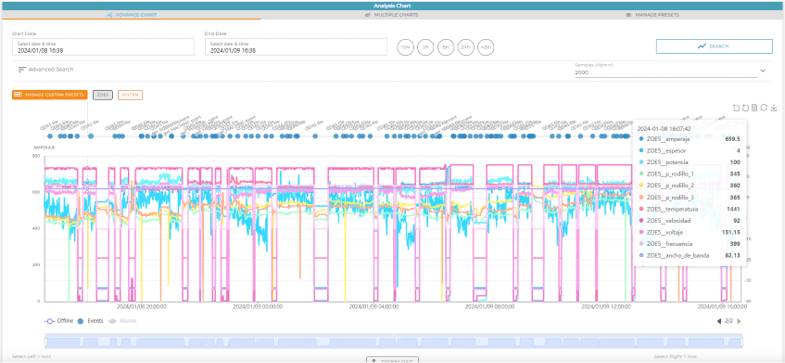
It allows the analysis of process parameter trends over time, with the ability to zoom in on key moments to closely examine the equipment’s historical behavior.
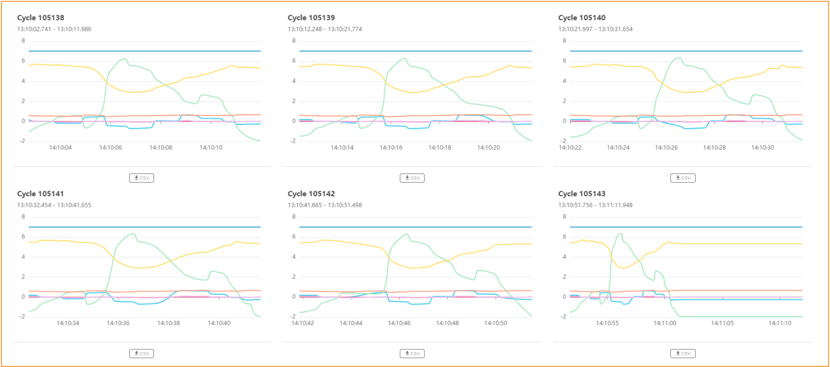
It records high-frequency data around specific events, providing high granularity and enhancing analytical capabilities, enabling a precise understanding of machine operation and quick diagnostics in the event of incidents.

KPIs and INSIGHTS
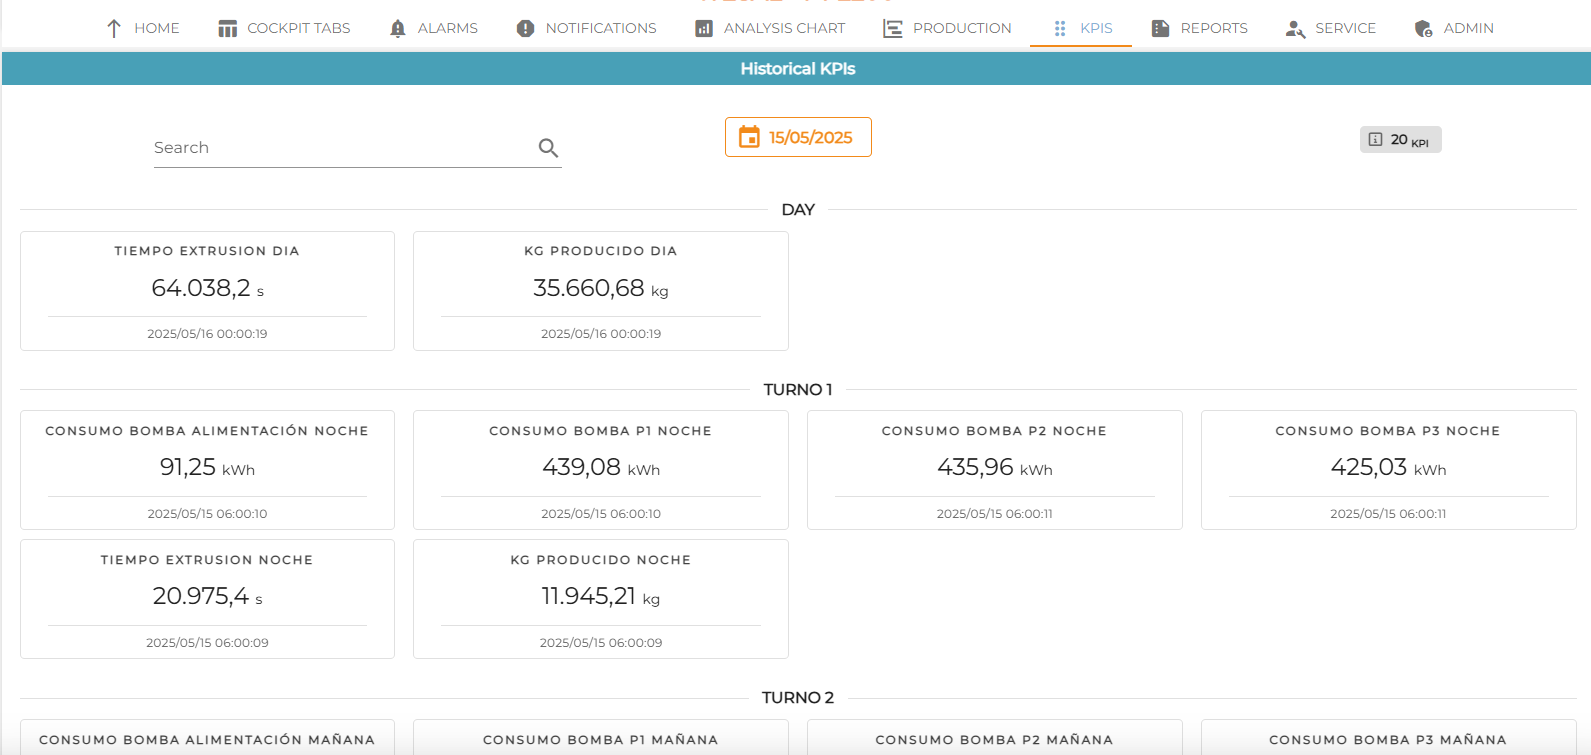
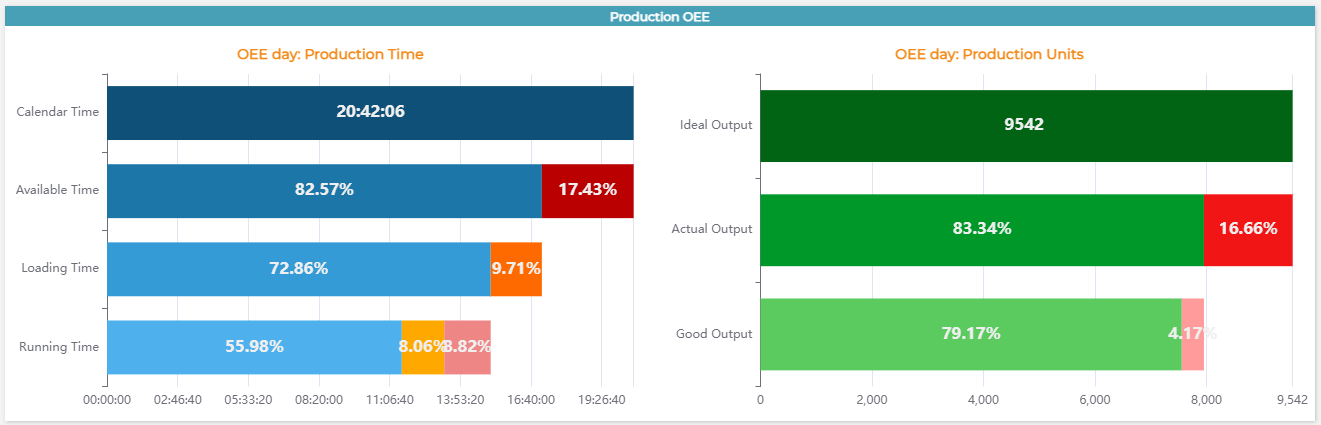
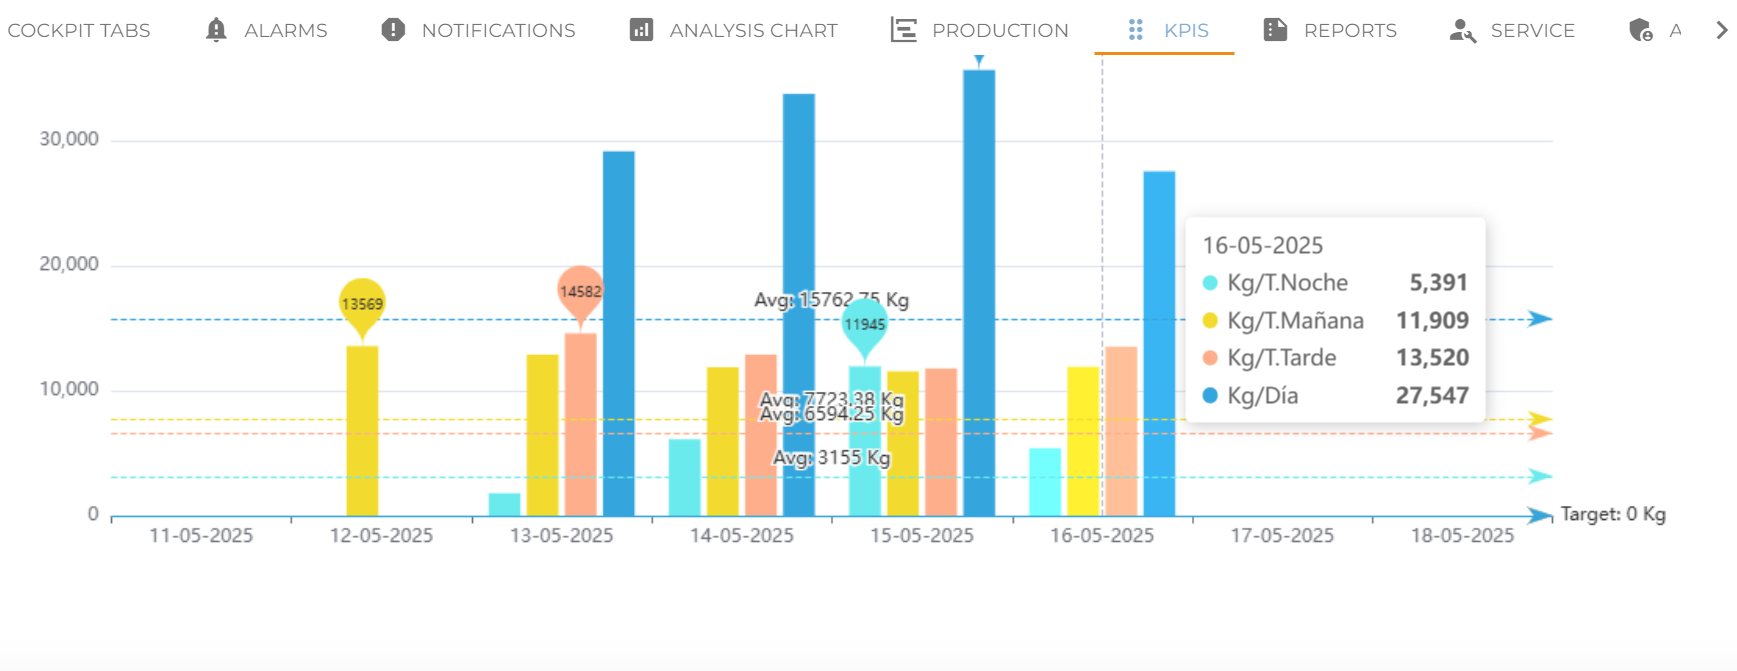
In combination with the PERFORMANCE app, it enables visualization of the most relevant metrics and indicators for equipment operation.
It provides a comprehensive view through indicators of operational efficiency, production, and asset status, facilitating performance monitoring and data-driven decision-making.

